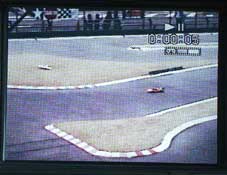
My car on recording the data.
Analysis of the Rev-logger data of a circuit run
01/Apr/2000
 Here, I try to analyze the data recorded with Rev-logger at a circuit run. It seemed to be difficult to correlate a position of a car at a certain time when only data was seen. So, I asked my friend to record a video at same time.
|
|
My car on recording the data. |
1. Speed at each section in the circuit
 Colored-number are correlated with a circuit map. At this trial, a lap time was 15.9s. bad cornering at sction 8 and 12 :-).
The maximum speed was 13.3m/s(48km/h).I was impressed that decreasing rate by braking was so fast than I imaged.
2. Cornaring speed and cornaring force
Average cornering-speed at each corner was calculated from 6 run data.
corner#(see above map) |
10 |
12 |
2 |
4 |
6 |
8 |
average velocity(m/s) |
5.84 |
5.65 |
6.92 |
7.88 |
9.51 |
8.26 |
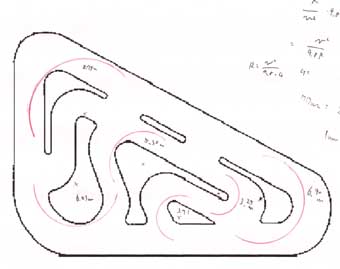
corner# |
10 |
12 |
2 |
4 |
6 |
8 |
corner radius(m) |
3.71 |
3.29 |
5.30 |
6.63 |
8.75 |
6.90 |
Now we can calculate centrifugal force with a equation below.
velocity(m/s)^2 = centrifigual force(G)*9.8*cornering radius(m)
How about a real value....?
X axis is cornering radius(m), Y is velocity^2(m^2/s^2).
Great!!! very beautiful correlationship!!
The cornering force equals centrifugal force, thus, Cornering force could be obtained with below equation.
Cornering force(G) = velocity(m/s)^2 / ( 9.8*cornering radius(m))
From the graph,
Cornering forceÅÅ1.0G
was the conclusion.
3. Acceleration
A rate of accelerating, increase of velocuity in a certain period, is highest at the point of velocity=0, and as get faster, acceleration become lower. That was due to the charactor of a motor torque profile. If acceleration decreased to 0, that is a maximum speed of that chassis.
On the other page of my websites, I have written about simulation system of the R/C car. (Sorry now only in japanese.) According to that system, theoretical acceleration can be calculated.
The graph below is a plot of acceleration from the data obtained this time.
X axis is a velocity at a certain time, and Y is acceleration after this point during 0.32sec.
As initial verocity get higher, it was found acceleration goes down as expected.
Next, theoretical value is calculated.
Parameters used for the calculation
Motor power |
max revolution |
21500rpm |
measured with QUAL-7 |
max torque |
1.621kg-cm |
measured with QUAL-7 |
|
weight of car |
1300Çá |
measured value |
|
diameter of driving tyre |
55mm |
measured value |
|
gear ratio |
3.72 |
measured value |
|
efficancy of force transfer |
0.95 |
assumed value |
|
factor ofrolling resistance |
0.05 |
assumed value |
|
air resistanceÅiCDÅj |
0.7 |
assumed value |
|
front area of the body |
0.018m2 |
assumed value |
|
weight of moving parts |
0.1kg |
assumed value |
|
How is the matching of these calculation??
The red line means theoretical maximum acceleration values.
What a correct value!! Incredible!!